Logs now available in the browser
Published
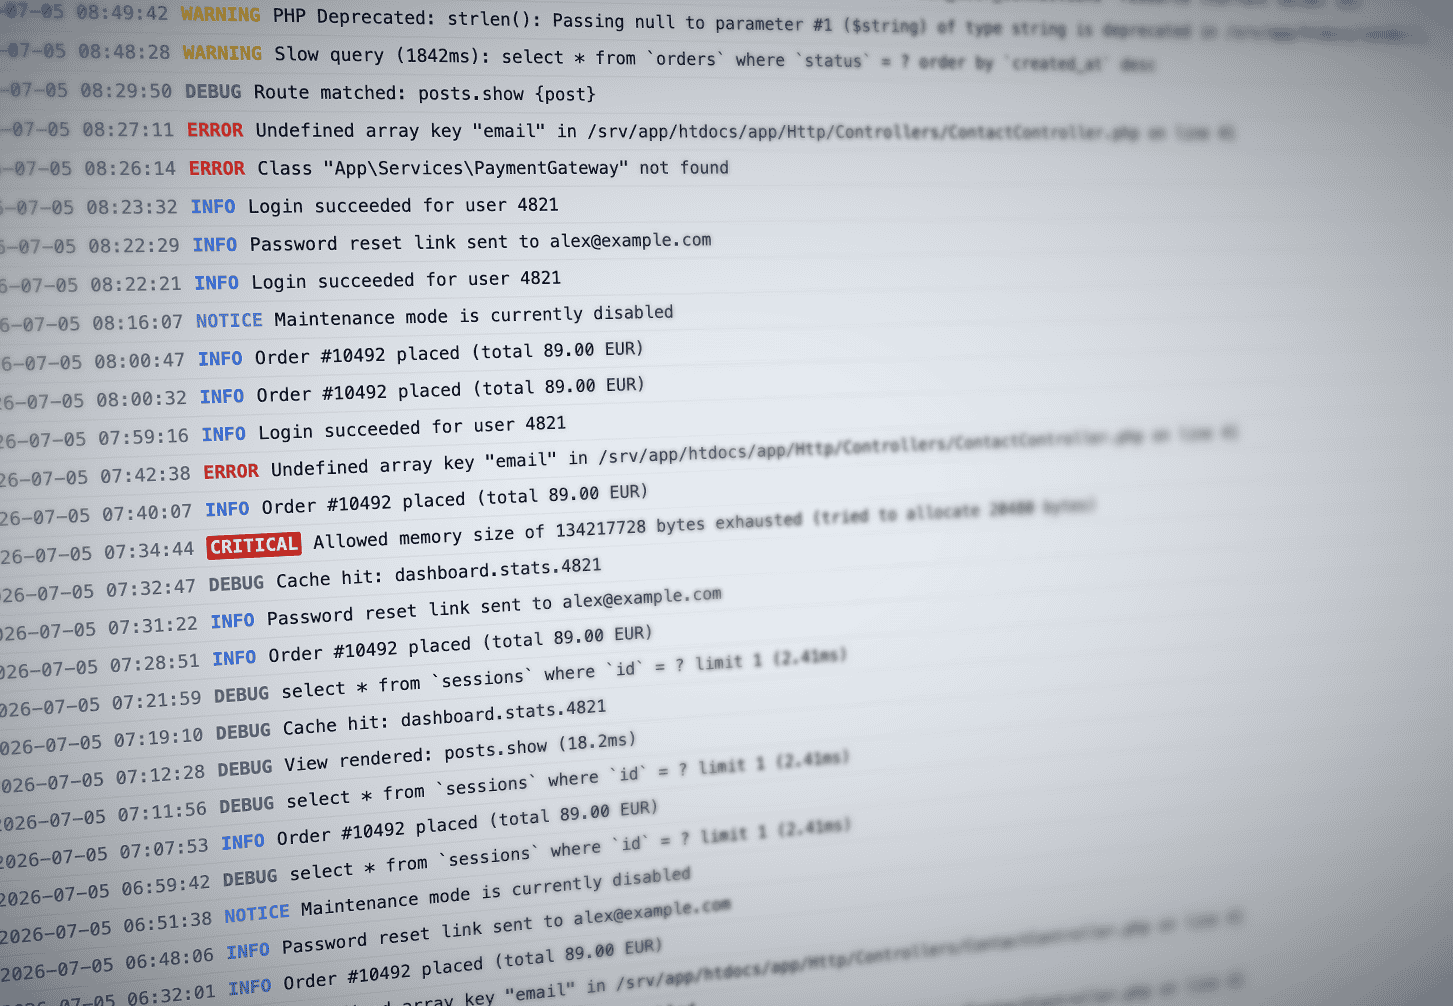
Nobody picks a web host for its log viewer. Yet. We believe observability is key. So we've built a nice log view for the browser.
The importance of server logs
You experience slow load times, error pages, or the white screen of death. Most of those issues are code- or config-related and we are happy to help. What does the log say? This is the first step in troubleshooting. But it's not something every PHP developer is comfortable with — we know this from support.
Meet the new browser logs
Design for failure. The browser-based interface makes it easy to explore logs without much effort. It has some nice features like log filtering, real-time updates, IP look up and linked documentation. It looks nice in dark and light mode and with all of our color themes.
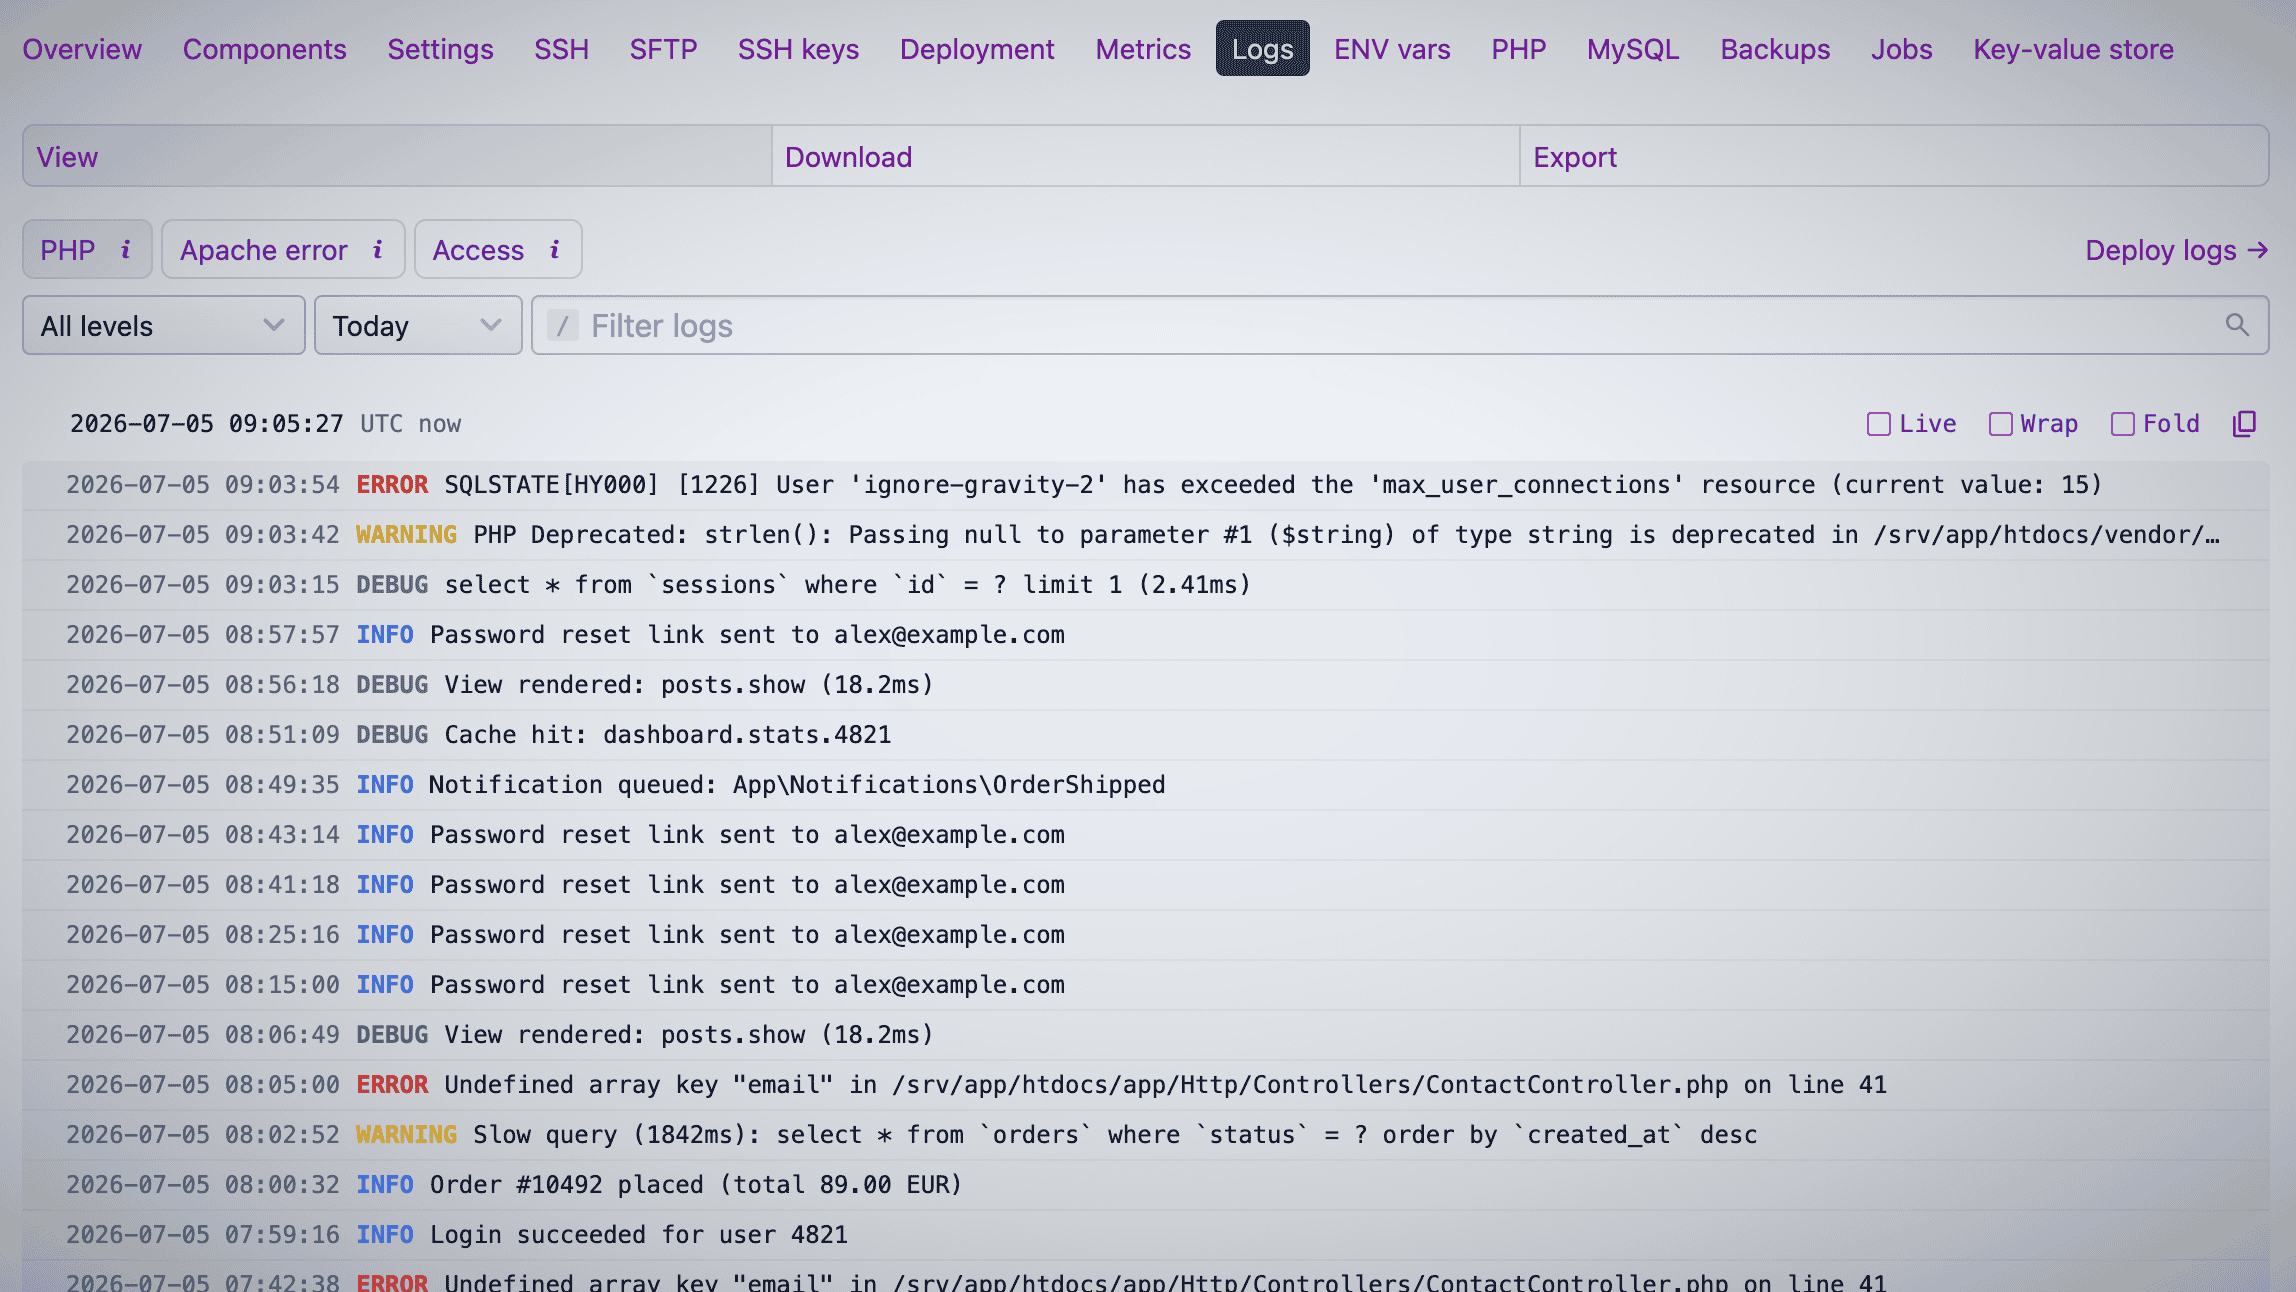
Logs are available in the Logs tab of each environment, in the new dashboard.
Log sources
- PHP log — uncaught exceptions, fatals, warnings, notices.
- Access log — one line per request: method, path, status, IP, user agent.
- Apache error log — rewrites, permissions, denied access.
- Jobs log — PHP output from workers and scheduled commands.
The sources map to the layers a request passes through, so the failed page and the reason behind it often sit in different logs.
Filter and follow
- Filter by level, or by method and status for access logs.
- Click an IP to filter for it, or look it up on
ipinfo.io. - Free-text search across visible lines.
- Pick a time range — today, yesterday, or a custom day and hour.
- Follow live to watch new lines arrive.
- Load more to page back through history.
Download logs from the browser
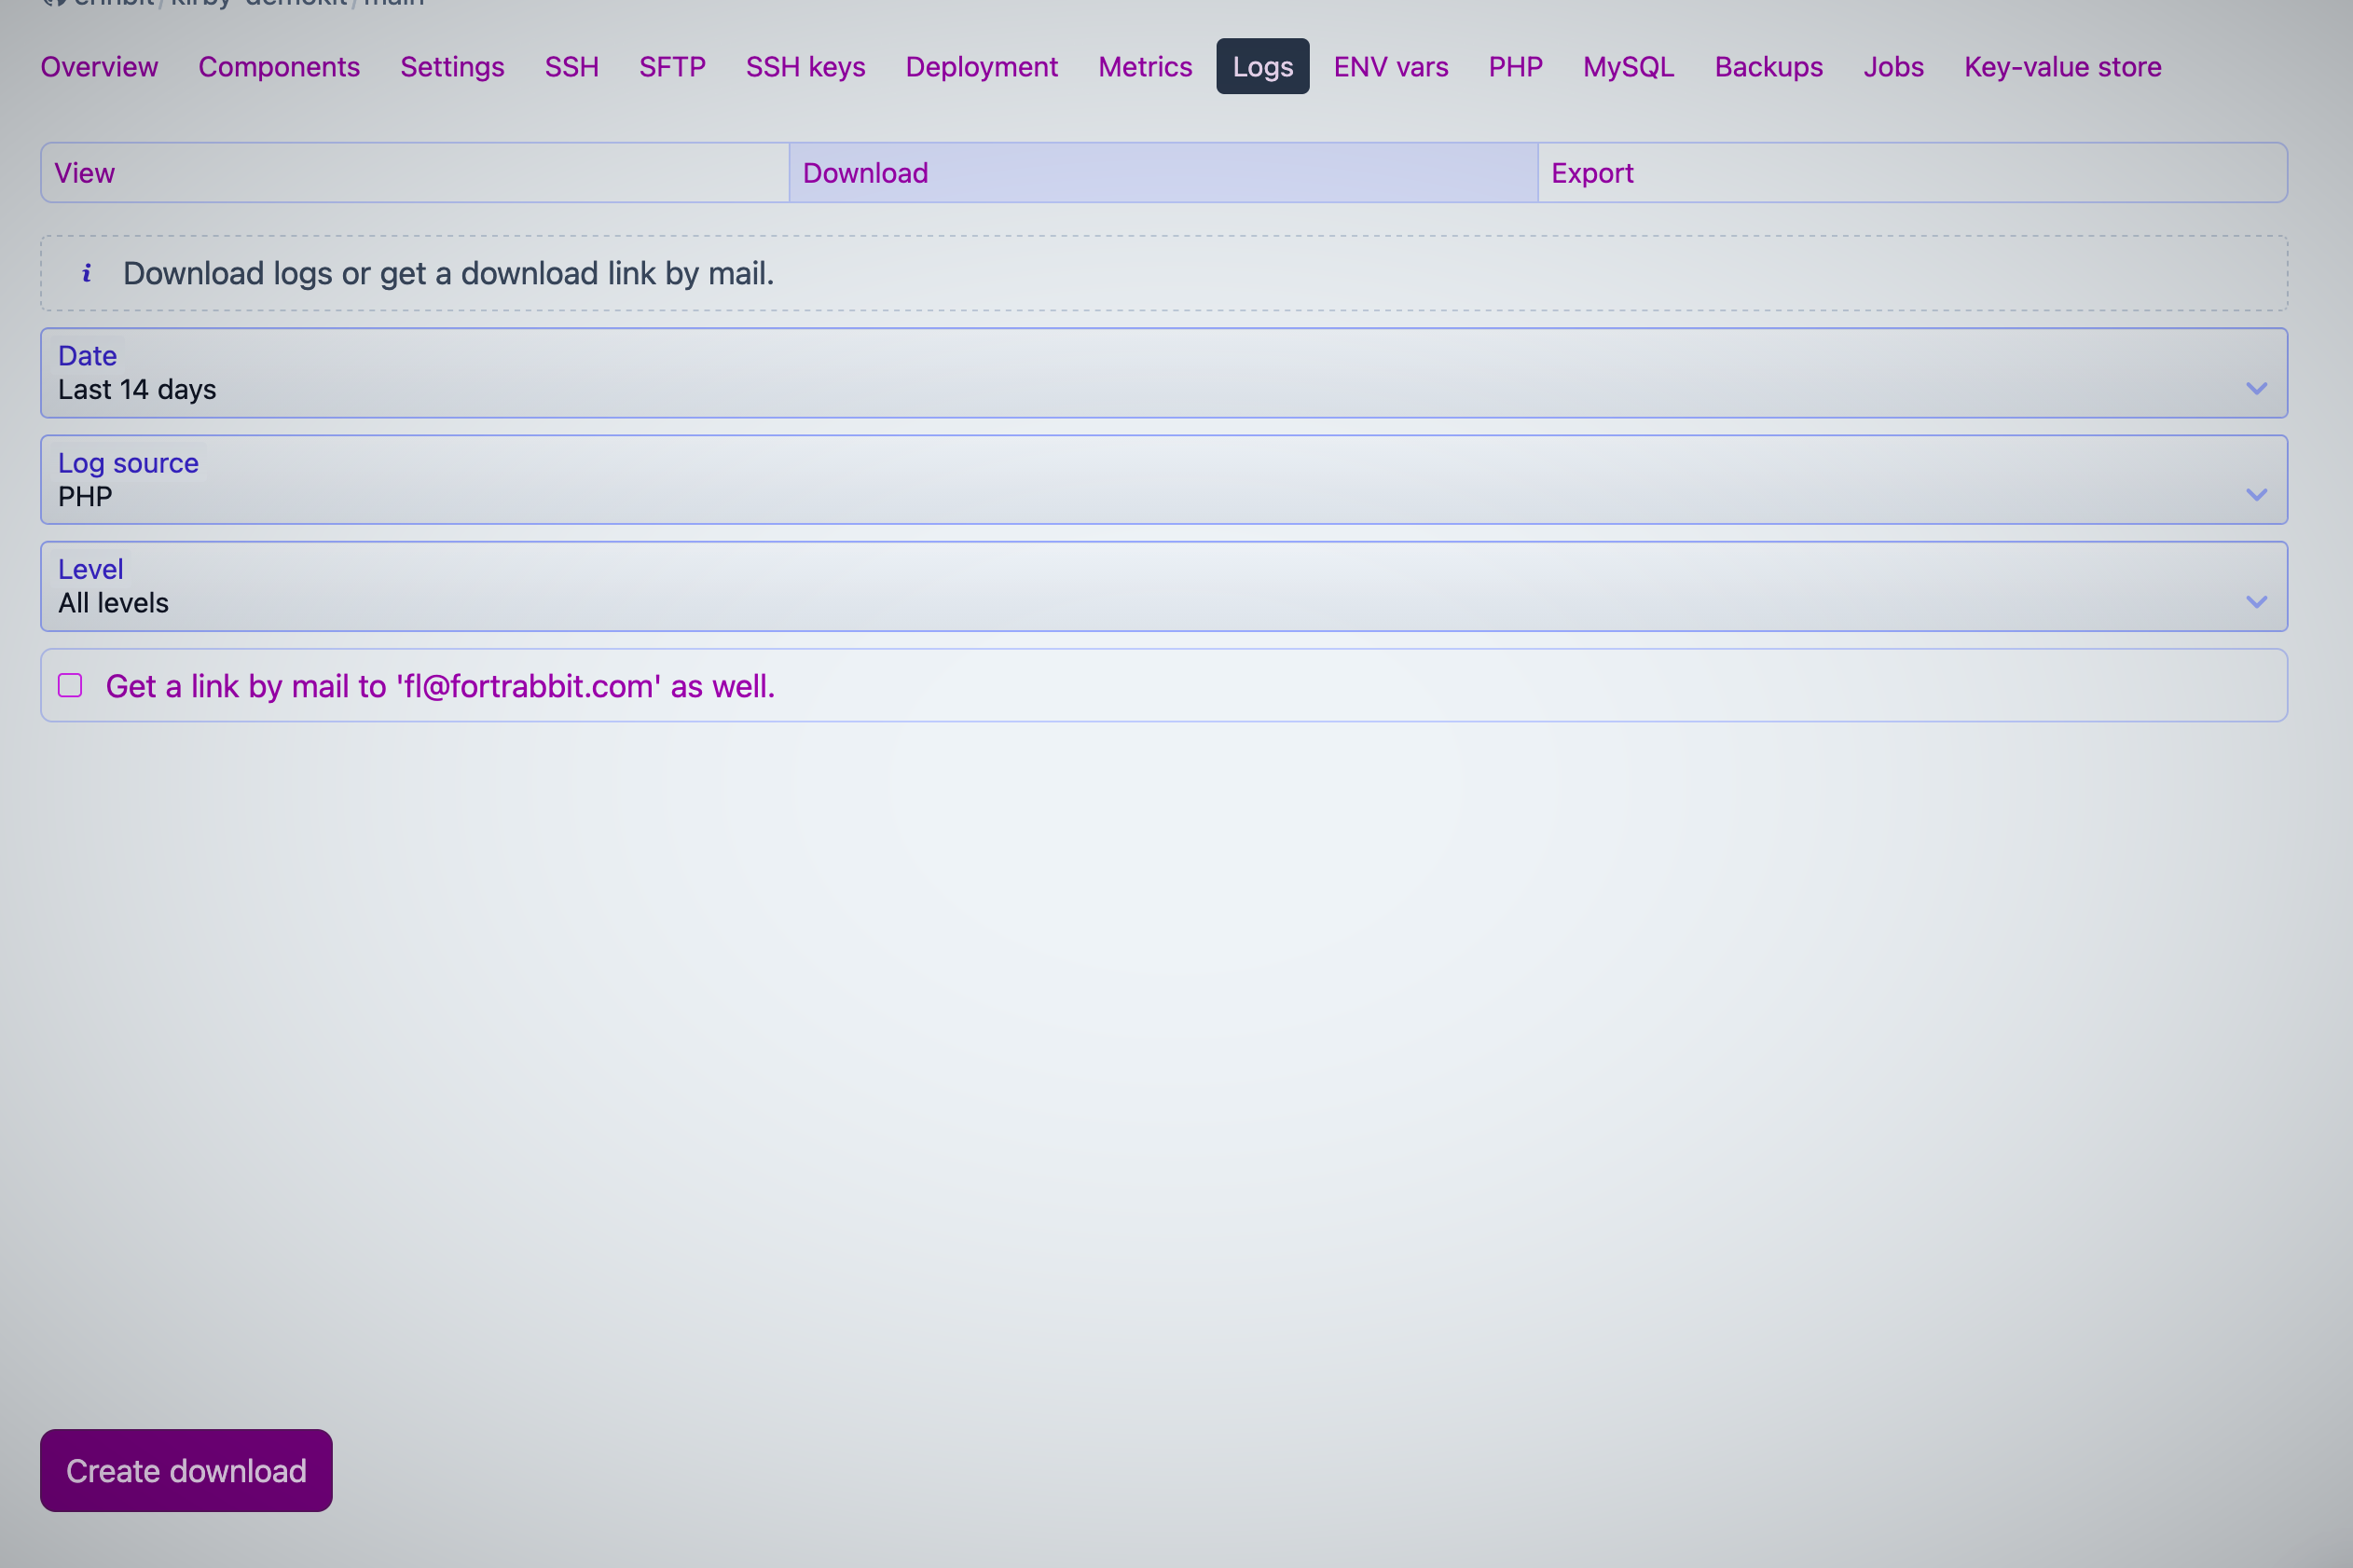
While the browser is a great way to get a quick view of your logs, you may need the raw file for a deeper look. Switch to Download, pick a source and a range, and a link is mailed once the export is ready. Larger ranges take a few minutes to prepare.
Keeping the tail command around
We'll keep frbit-tail-logs around for a while. But we may kill it in the future.
New log docs
We gave the docs a pass while we were at it.
- Logs docs - covers each source, filters and more.
- Apache error codes - the
AHxxxxxcodes, and how to read them. - HTTP status codes - what a 500, 503, or 504 in the access log actually means.
Costs
The new log browser is free to use and included with all plans.
State
We are kindly asking customers to try it out and provide feedback. This feature will need to grow; we'll learn and iterate. But we need actual data and experience with live websites now.
Outlook
We have two major observability features planned: Metrics will extend the logs with empirical data, shown as graphs and charts. Events will record all user interactions and events. We also have ideas to extend the log viewer with an export option, to send a stream of logs to a third-party service.
But we are also working on automation and improved agentic workflows with a public API and MCP.
We are also working on small improvements and bug fixes, step by step, getting closer to a production-grade state, ready for public release.