Essential metrics are here
Created
🦋
Essential metrics help you track usage data for web storage, MySQL storage, and traffic.
What's new?
The environment overview of the dashboard now shows usage data for components that report usage:
- MySQL - database storage used, now
- Traffic - outbound traffic, so far this month
- Storage - sum of all files on the file system, now
You can see the current state and update component plans accordingly. Usage is also plotted alongside the component booking for reference. With this update, actual usage is compared against the plan.
This is the first iteration in a series of updates about metrics.
Current limits
The current implementation provides a snapshot of usage; there is no historical data available yet. The latest state gets pulled every minute.
Live dashboard updates
Some customers noticed that not all updates are pushed into the browser within the dashboard SPA. For the important parts, we have implemented polling. The goal is to have server-side events with live updates pushed into the dashboard. That is a larger development project and will improve the dashboard experience with better observability. This will include infrastructure-related events, but also dashboard events like collaboration.
Detailed metrics
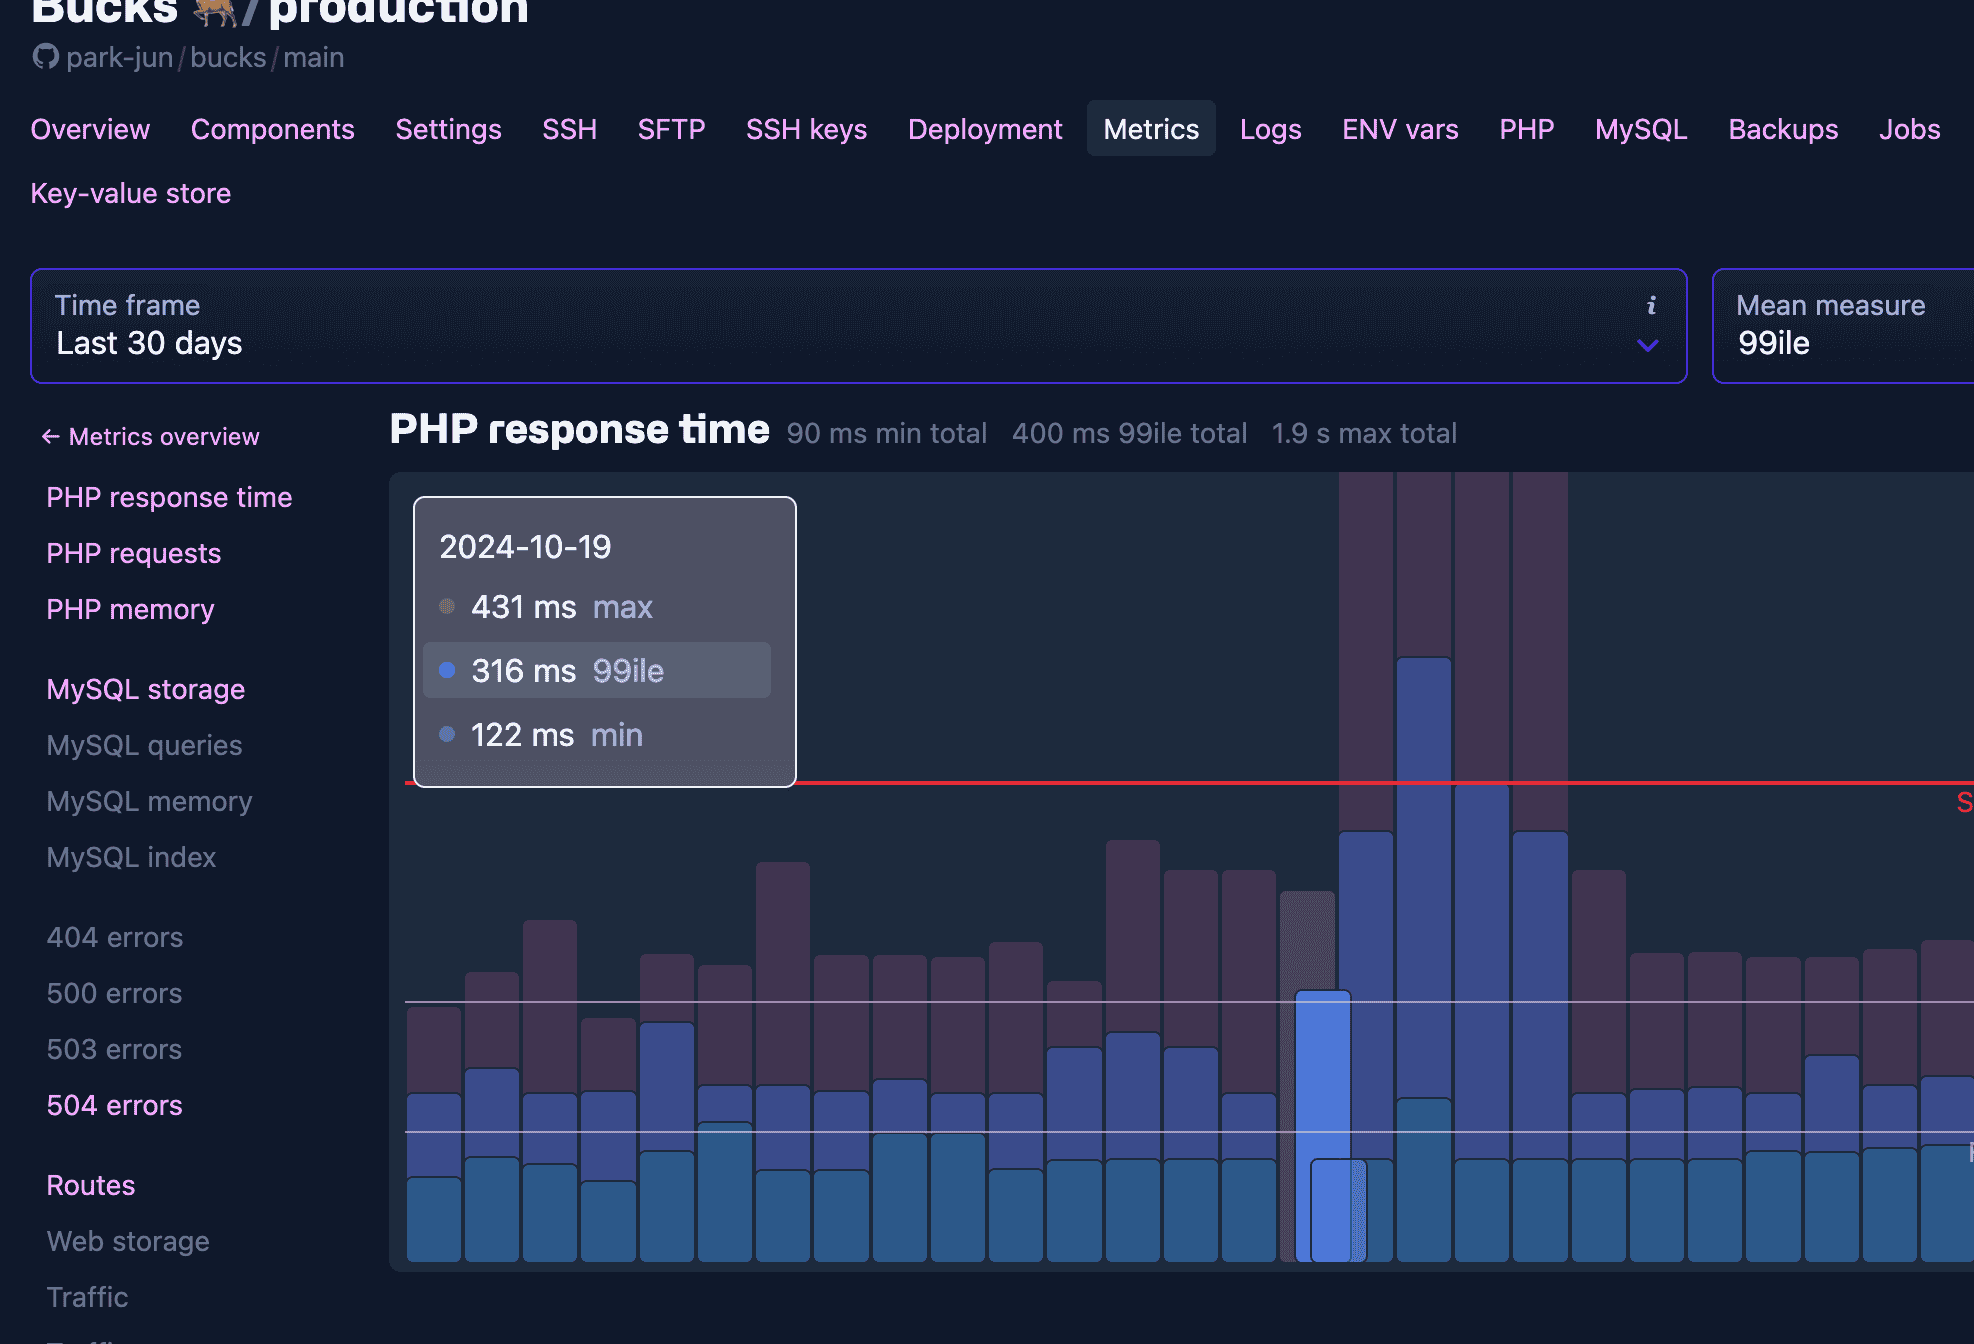
The above image is an early prototype. It will look better later on.
Another ambitious project is to show server-side generated metrics. Users of the old platform may have noticed that common metrics are still missing in the new platform. PHP response time, CPU allocation, requests, and many other server metrics are not shown yet. We already have most parts of the backend ready, but we cannot show that yet in the dashboard. The metrics for the new platform will build on what we have learned over the past decade with the old platform. It will help in two ways:
- Performance insights - not replacing APM services, but already good
- Usage data - not replacing Web analytics, but already good
Metrics will include plotted graphs over time. With the live update features described above, new metrics will be pushed into the browser.
Logs
We also plan to bring log access directly into the dashboard. With live updates, users can tail and filter logs by time range and type.
Thanks
It is an honor for us to work with our helpful beta testers. Feedback so far is very good. The beta is paid, but we are happy to apply a discount for feedback, ideas, and use cases.