Metrics landed
Published
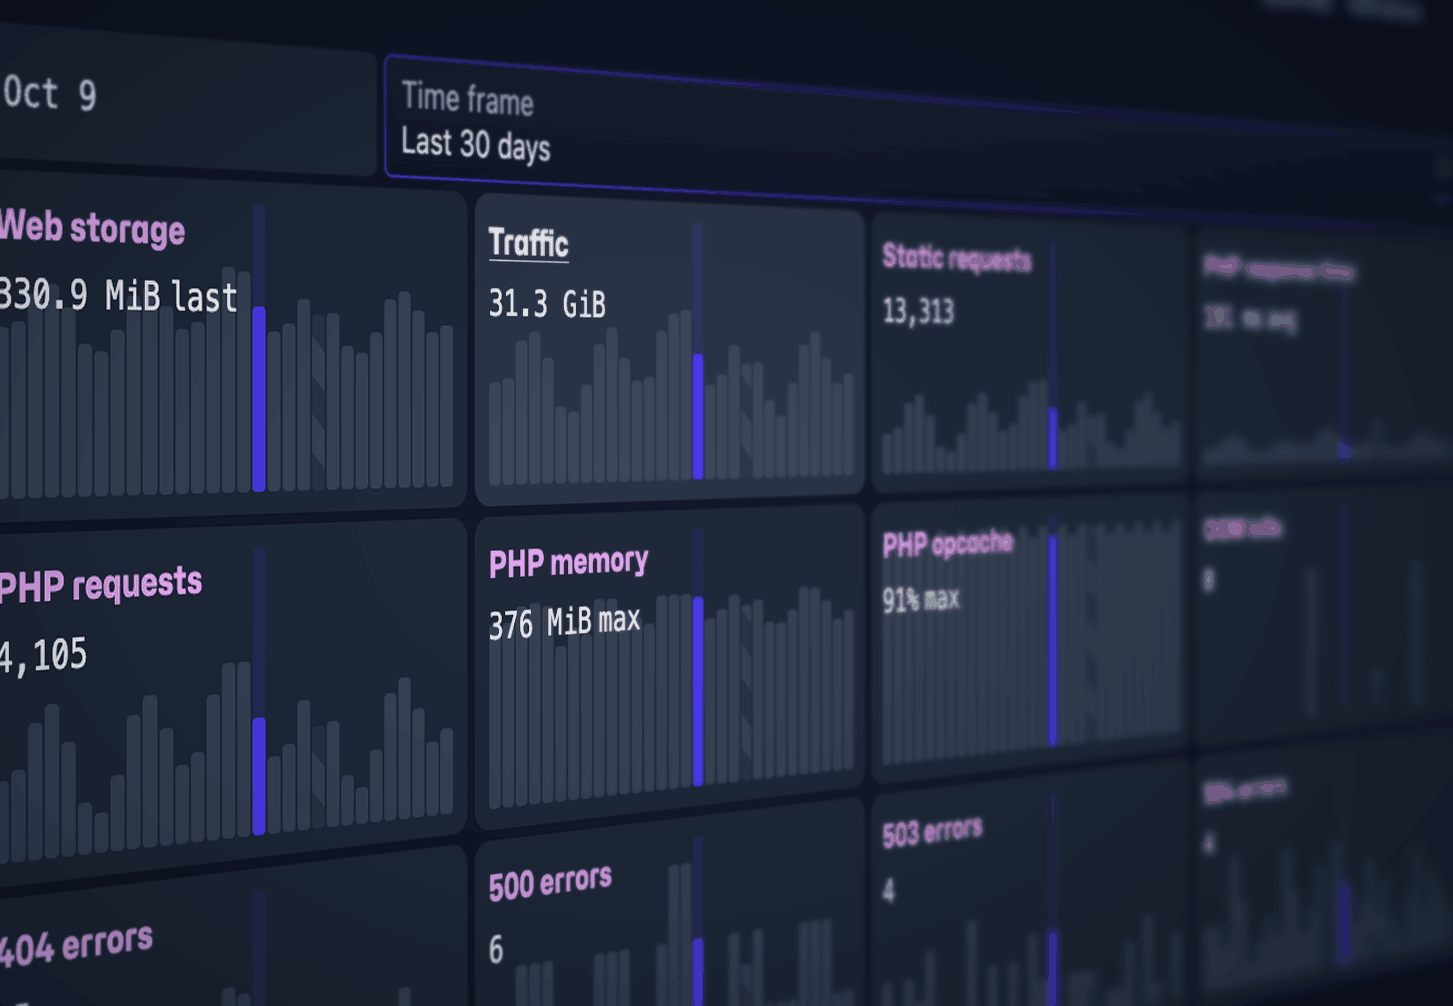
The new platform dashboard shows metrics now. It graphs storage, traffic, MySQL, PHP, jobs and HTTP errors over time, one bar per hour or day. Available in your browser.
In July we put the logs in the browser and promised metrics next. Here they are. See how many requests came in, how fast they were answered, how much memory they used, and how many ended in a 500.
Server-side data, no JS on the website
No JS, no privacy concerns. The platform samples services at short intervals and groups the samples into bars. The charts count what the server handled, with no script in the page and no cookie. I have always liked AWStats. Now we have our own.
Available metrics
| Group | Metrics |
|---|---|
| Storage & traffic | Web storage, traffic, static requests |
| MySQL | Storage |
| PHP | Response time, requests, memory, OPcache, OOM kills |
| Jobs | Memory, OOM kills |
| Errors | 404, 500, 503, 504 |
MySQL and jobs metrics show up when the environment has those components.
Summary page
The summary puts all metrics of an environment on one screen, one small chart each. Hover a bar and the same hour or day lights up in every chart, so a traffic peak and a slow PHP response line up side by side.
Single chart
Hover or click a bar to see its values in the box on the left. Without a selection, the box covers the whole time frame. Lines mark thresholds, such as Slow for the PHP response time, or the memory of each PHP plan. Links below a chart open the logs of the same time frame.
Time frames
The time frame sets the size of a bar: one per hour for the last two days, one per day for longer ranges.
Scale slider
One slow hour can flatten everything else in the chart. The Scale slider enlarges the small bars, so the quiet hours show their shape again.
Average, median, 99ile
PHP response time is the key number for PHP performance, and it's easy to misread. Each bar shows the slowest request of the hour or day. Below it sits one more value, picked from average, median and 99ile.
A few stuck requests drag the average up, while the median barely moves. The 99ile shows slow requests once they make up more than one in 100. The docs walk through it with 1,000 requests and one that hangs:
Outlook
As usual, this is the first iteration. Putting it live is the litmus test. We will need to tweak it, and we plan to build on it.
- Metrics via API (so your agent can read them right away)
- Table data on MySQL queries, jobs processes and more
Tell us what is missing, or what reads wrong.